Introducing

analytiQa is a powerful QA analytics platform designed for modern engineering teams. Unifying your scattered test data from frameworks like Tricentis Tosca, NUnit, and JUnit into a single, insightful view, allowing you to stop chasing data and start driving quality.
Visualisations
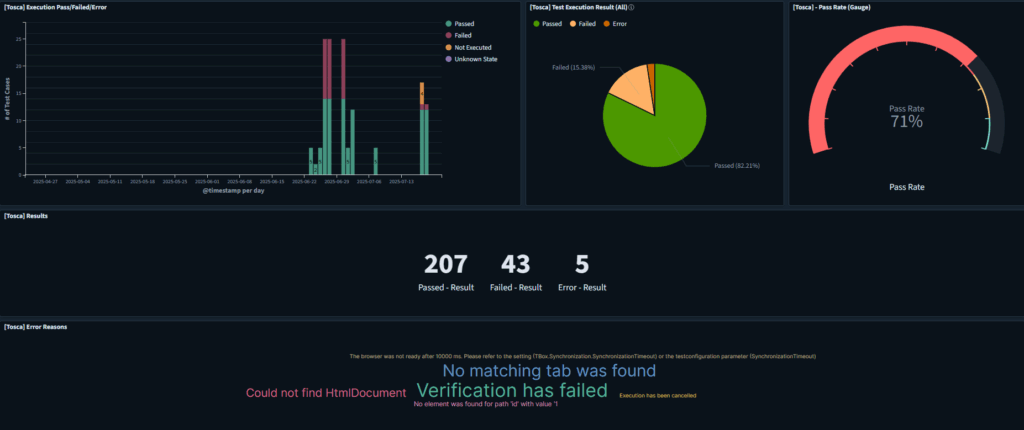
Move beyond simple pass/fail counts. analytiQa’s interactive visualizations transform raw test data into actionable intelligence, allowing you to instantly track flakiness trends and pinpoint failure hotspots with heatmaps.
Drill down from a high-level overview to the root cause in seconds.
Dashboards
Stop forcing your unique QA process into generic reports. analytiQa’s dashboard builder lets you create the exact views you need in minutes.
Craft a high-level summary for leadership or a deep-dive diagnostic for your engineers— it’s the ultimate flexibility to give every stakeholder the quality insights they care about most.
Analytics and Insights
analytiQa is an enterprise-grade Analytics and Insights platform designed to provide a holistic view of your quality assurance efforts. It seamlessly ingests and normalizes test data from diverse sources, including Tricentis Tosca, NUnit, and JUnit.
analytiqa empowers QA leaders and stakeholders to move from isolated reports to integrated, strategic insights, enabling data-driven decisions and ensuring comprehensive quality oversight.
Product Connectors
The power of our platform lies in its robust library of product connectors. These connectors are purpose-built to seamlessly integrate with a wide range of industry-leading commercial and open-source testing products.
They automate the complex process of data extraction, normalization, and ingestion, ensuring that all your quality data is consistently and reliably fed into a central analytics engine. This eliminates manual data handling and provides the clean, consolidated data stream necessary for high-fidelity insights and reporting.
Simple Notifications
Go beyond dashboards and never miss a critical failure again. Our platform’s automated notifications act as the frontline alarm for your quality process. Receive immediate alerts for high-severity test failures and broken builds directly in your team’s Slack, Microsoft Teams, or email inbox.
By drastically reducing discovery time from hours to seconds, filtering out noise to focus on what matters, our notification system empowers your team to respond instantly and effectively. Stay proactive, focused, and in control of your quality pipeline.
Always Expanding
The world of QA tools is constantly evolving, and so is analytiQa. At Qualtiva, we are committed to continuously expanding analytiQa’s library of native connector agents to ensure you can always pull data from the platforms you rely on.
Our development roadmap is a collaborative process. We partner directly with our customers to understand their needs and build the integrations that matter most. Your voice helps the team at Qualtiva shape the future of analytiQa together.
All of your insights and analytics in one place!


Dashboards & Analytics
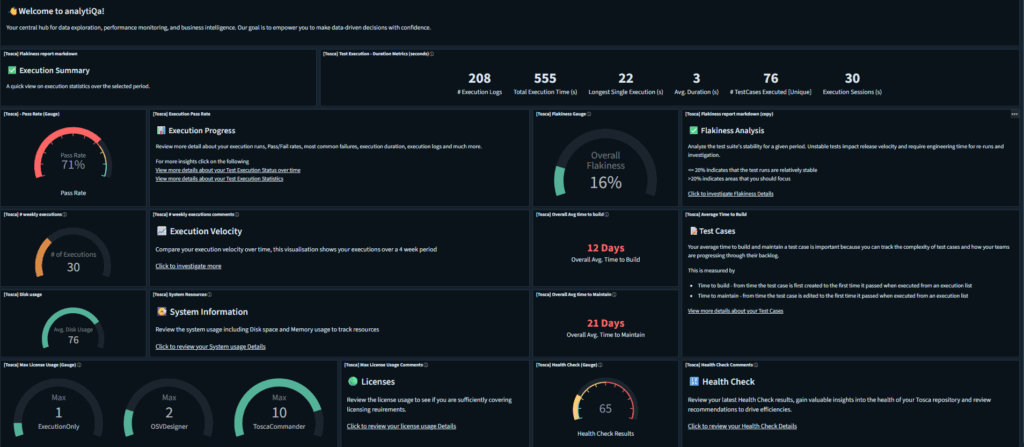
A great dashboard brings all the critical pieces together. In analytiQa, dashboards are your strategic overview—a single pane of glass where you can monitor the complete health of your quality process at a glance.
Assemble and arrange any visualization from our library—or your own custom creations—into a layout that tells your unique story. Track high-level KPIs for an executive audience, create a detailed diagnostic view for your QA team, or monitor specific module health for your developers. With analytiQa dashboards, you move from individual metrics to a powerful, consolidated view.
Visualizations
A single data point is noise; a visualization tells a story.
The visualization engine in analytiQa is designed to transform your raw QA data into clear, insightful graphics that answer your most specific questions.
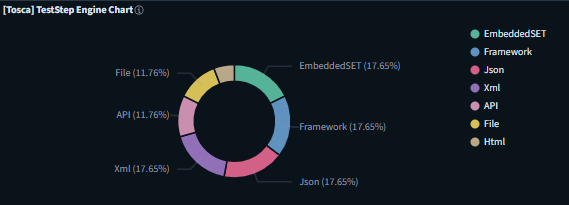
Get started instantly with our rich library of pre-configured visualizations—from trend lines for pass/fail rates to pie charts of technologies tested.
Need to track a unique metric? Dive deeper and build your own custom visuals from the ground up with our intuitive tools. Each visualization is a powerful, self-contained insight and the fundamental building block for your dashboards.


Connector Agents
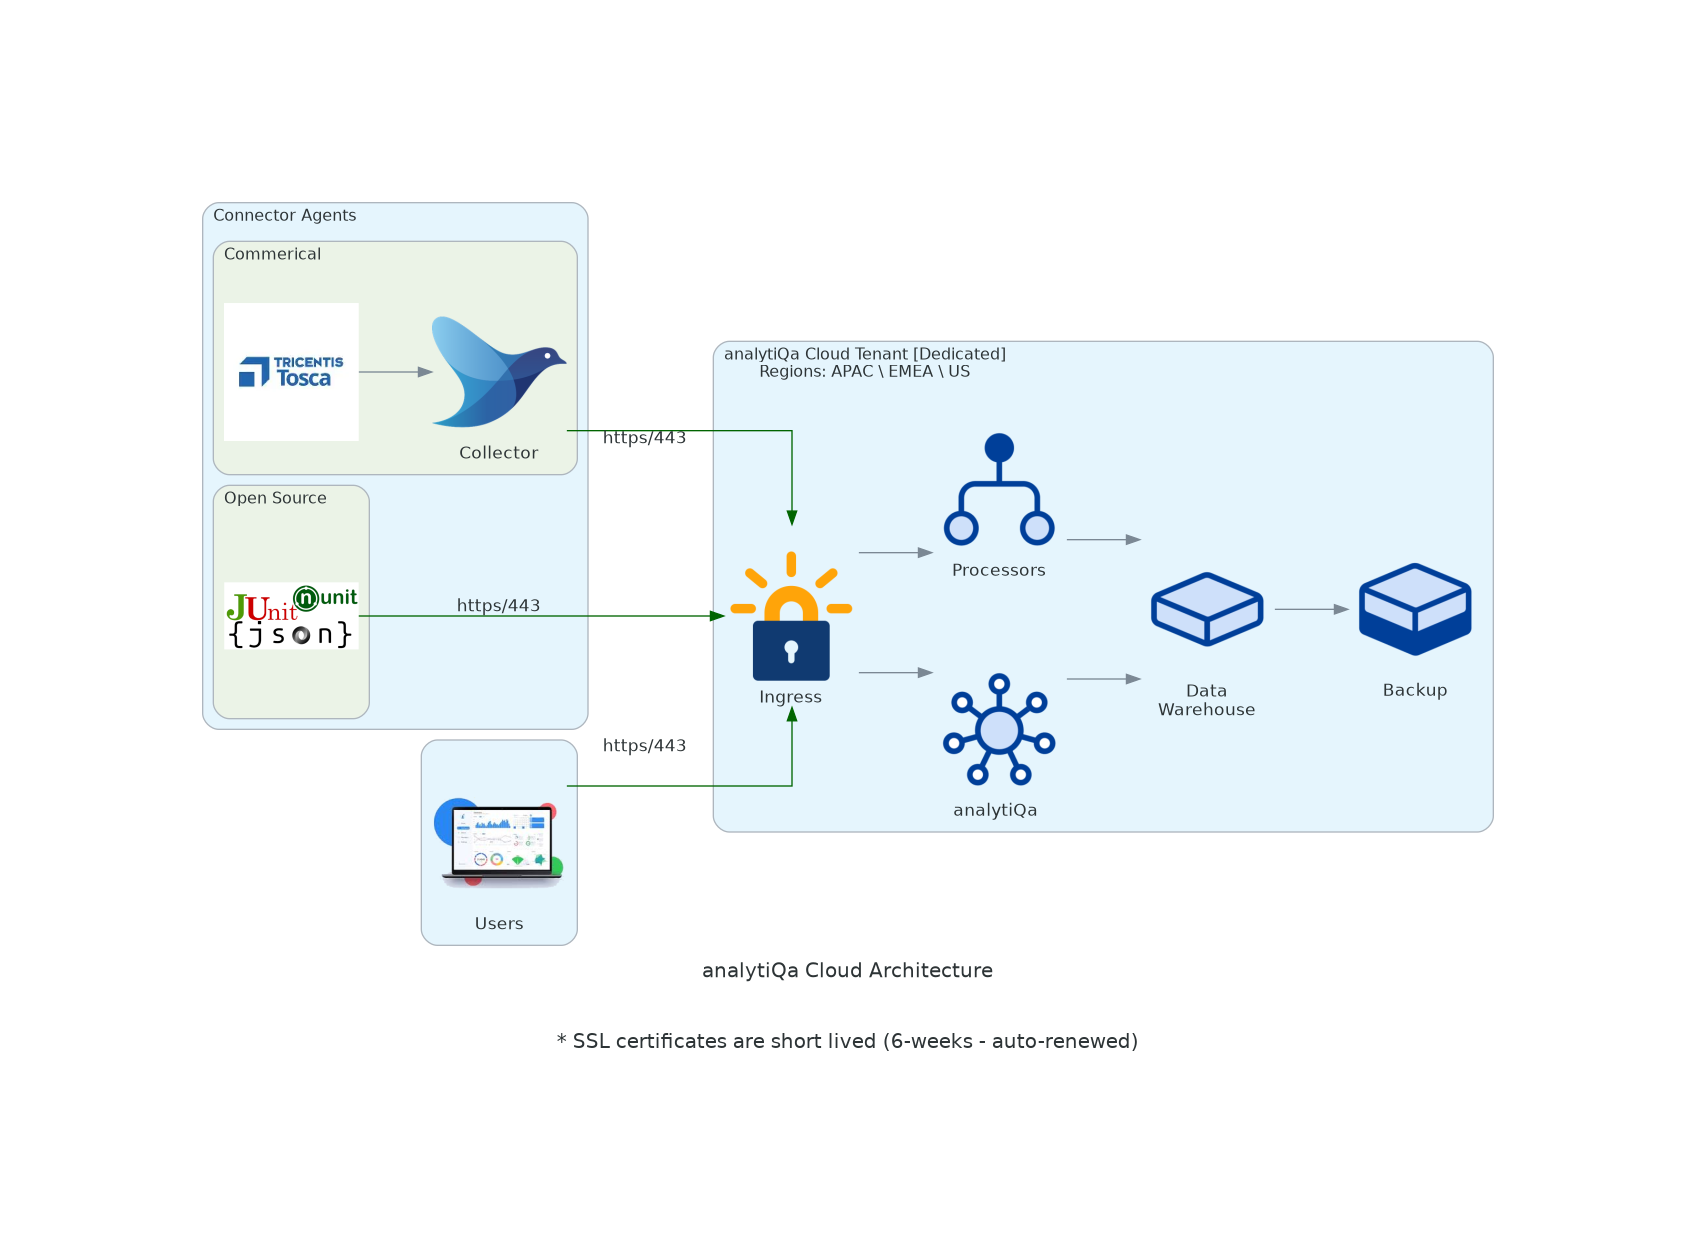
Your insights are only as good as your data, and our connectivity solutions ensure that data is always fresh, accurate, and complete. They are the heart of analytiQa, designed to seamlessly and reliably bring information from your entire testing ecosystem into one place.
Our approach is tailored to each source. For enterprise platforms like Tricentis Tosca, our purpose-built agent intelligently extracts results directly from the environment. For open-source frameworks like NUnit and JUnit, analytiQa provides a secure listener that receives data as it’s pushed from your build pipeline.
This flexible approach ensures that, regardless of the source, the process is automated. It eliminates manual exports and creates a continuous pipeline of clean data, so you can focus on what comes next: analysis, visualization, and insight.

Stakeholder reporting
Generic reports create noise, not clarity. analytiQa ensures that every stakeholder—from the boardroom to the development floor—receives a clear, relevant, and actionable view of quality. Our flexible reporting capabilities allow you to create tailored dashboards for every role, turning scattered data into focused intelligence.
- For Executive Leadership: Deliver at-a-glance summaries that answer the big questions. Provide your VPs and Directors with high-level dashboards showing overall release readiness, and key quality trends, enabling confident, data-driven business decisions.
- For QA & Test Leads: Command your entire quality operation. Build a detailed command center to monitor test effectiveness, analyze defect trends, and pinpoint bottlenecks, giving you complete operational oversight to optimize your entire testing process.
- For Product Managers: Connect quality directly to business value. Create reports that track the stability and success of specific features and user stories, ensuring every release aligns with customer expectations and product goals.
With analytiQa, reporting becomes a powerful tool for alignment, helping everyone speak the same language of quality.
