
Stop guessing. Start knowing. Your data, clarified by analytiQa.
Qualtiva presents analytiQa, the intuitive business intelligence platform that helps businesses transform complex QA data into clear, actionable insights
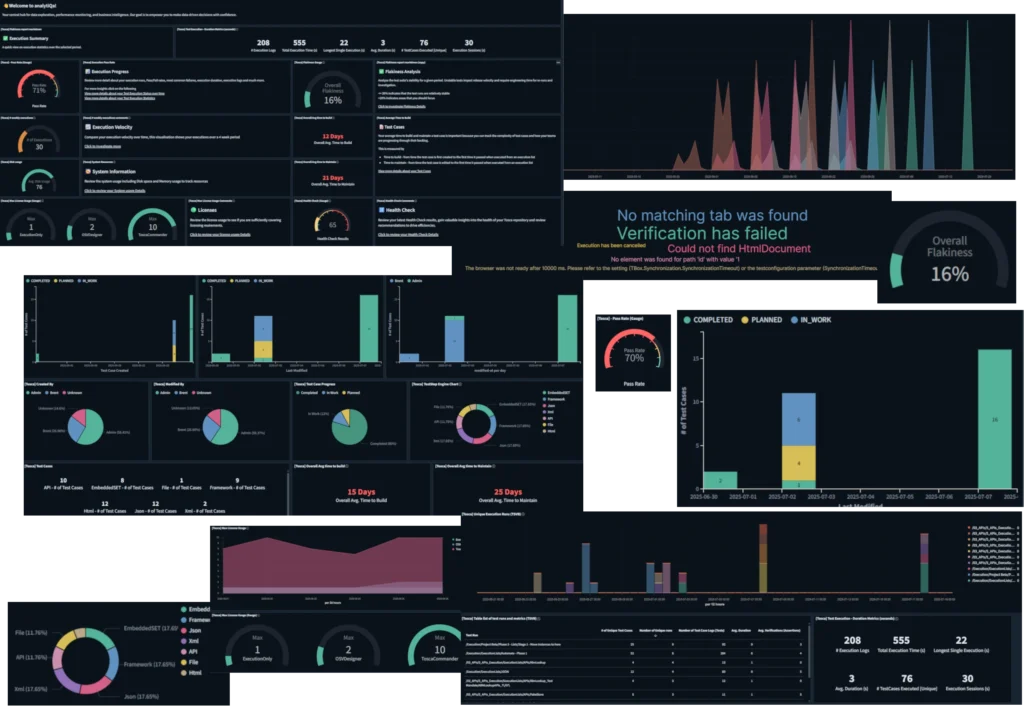

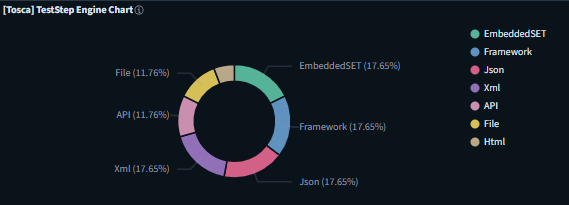
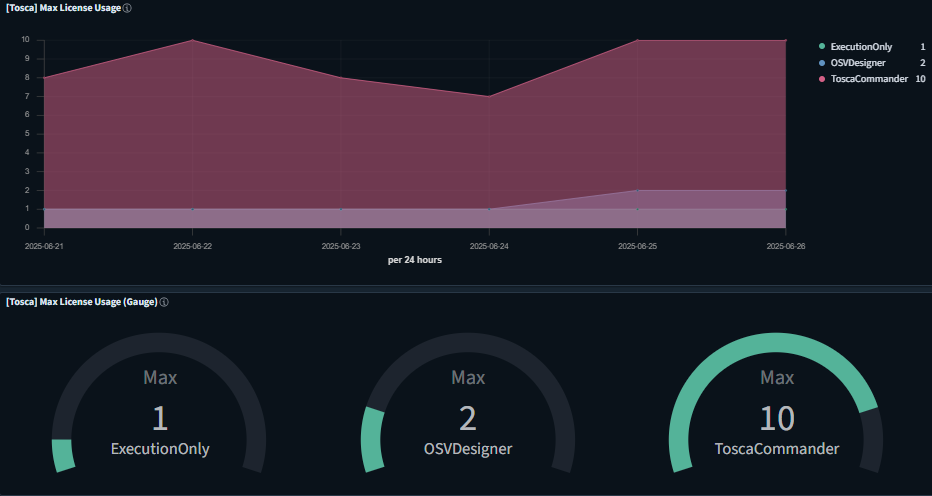
Insightful Visualizations
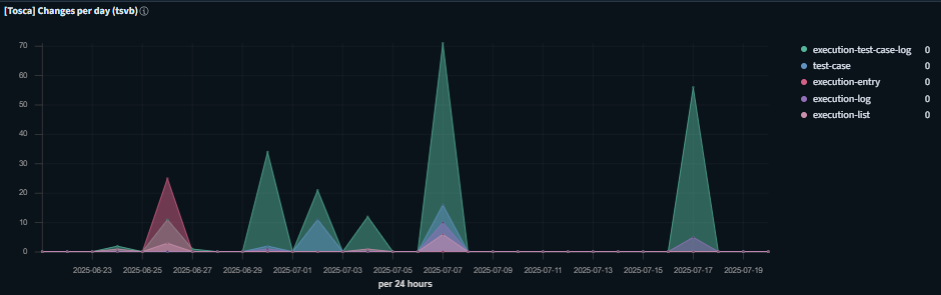
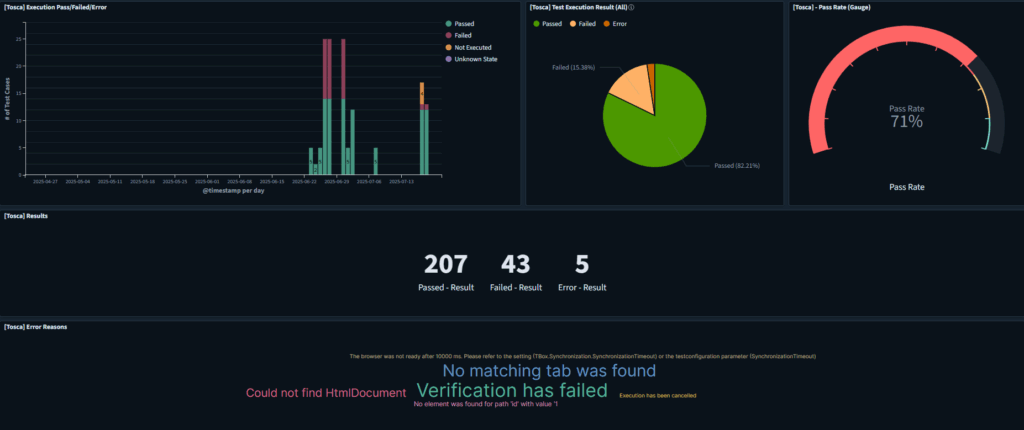
Move beyond simple pass/fail counts. analytiQa’s interactive visualizations transform raw test data into actionable intelligence, allowing you to instantly track flakiness trends and pinpoint failure hotspots.
Drill down from a high-level overview to the root cause in seconds.
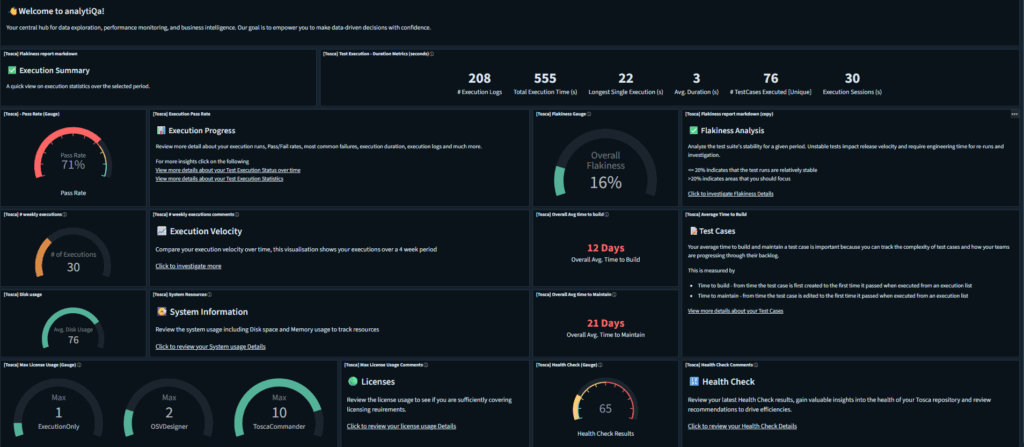
Tailored Dashboards
Stop forcing your unique QA process into generic reports. analytiQa’s dashboard builder lets you create the exact views you need in minutes.
Craft a high-level summary for leadership or a deep-dive diagnostic for your engineers—it’s the ultimate flexibility to give every stakeholder the quality insights they care about most.
Software with a Service (SwaS)
At Qualtiva, we don’t just sell software; we deliver a complete solution. Unlike traditional SaaS where “service” simply means the software is hosted for you, our SwaS model means we are your active partners in quality.
We are committed to ensuring you not only use our software, but that you truly succeed with it.
Smart Integrations
Connect your test ecosystem with ease. analytiQa plays well with Tricentis products, like Tosca, Open-Source products and more — allowing seamless data flow and unified analysis.
Whether it’s log ingestion, scheduled health checks, or real-time alerts, your tools talk the same language.
Quality Briefings
Stay informed, not overwhelmed. Get curated summaries of what matters most: high-impact failures, unstable test clusters, and platform health snapshots.
Delivered to dashboards or inboxes — so your QA team stays proactive, not reactive.
Always Expanding
Evolving with every release. Qualtiva’s product roadmap embraces continuous growth — from adding new extractor agents for deeper diagnostics, to modular plugins that extend analytiQa’s reach across your QA stack.
Future updates unlock smarter ingestion, cleaner insights, and adaptive logic designed to scale with your testing footprint.
Is This Your QA World, are you constantly asking these questions?
Intuitive Dashboards & Visualizations
A simple pass/fail count doesn’t tell you the whole story of your software’s quality. analytiQa’s insightful visualizations transform your raw test execution data into a clear, interactive narrative out of the box.
Instantly identify which tests are becoming flaky over time, see a heatmap of the skill matrix of your team, and drill down from a high-level trend to a specific execution runs and its associated log file in just a few clicks.
This is about moving beyond raw data and discovering actionable intelligence. Our platform enables your team to stop asking “What failed?” and start answering “Why did it fail, and how can we prevent it from happening again?”
Custom Dashboards & Visualizations Builder
Your testing strategy is unique; your dashboards should be too. analytiQa’s custom dashboard builder puts you in the driver’s seat.
With our intuitive interface, you can effortlessly create tailored views of your quality data, no coding required. Build a high-level quality health summary for leadership, a deep-dive diagnostic dashboard for your engineers, or track specific release readiness metrics for product managers.
This is about transforming your data into a shared language that every team can understand, ensuring everyone is aligned on quality goals.
From Complex Data to Clarity
Plug in what you need. Adapt as you grow.
Your QA data is valuable, but it’s often trapped in different tools and formats. analytiQa is designed to handle this entire journey for you, turning complexity into clarity.
It starts by simplifying data collection. Our powerful extractor agents and listeners automatically handle the heavy lifting of gathering data from all your sources, eliminating manual efforts. This raw information is then instantly rendered into the insightful, interactive visualizations and dashboards you need to understand your quality at a glance.
This is where analytiQa stands apart. Your business has unique needs, and your data should reflect them. We give you the unique ability to reshape, enrich, and transform your data post-ingestion. This means you can apply your own business logic to the data after it’s collected, ensuring the insights you see are perfectly aligned with how you work.
This end-to-end capability ensures you get more than just charts—you get tailored intelligence.
Special 2026 offer until 31 March 2026
Base
$1,300/mo*
$650/mo*
Professional
$1,900/mo*
$950/mo*
Enterprise
*All prices are in USD and billed annually